Sometimes the default MatLab colors for plottings are not satisfactory and I would like to define and use my own color schemes. When I see a beautiful color scheme, I also would like to save it to my color scheme library. But when I want to use a certain color scheme, it might be difficult to find it in my library. So here I created this project to save, preview and use customized color schemes in MatLab.
Optional. Function tiledlayout(), which was introduced to MatLab in vewrsion 2021a, is used in jlShowColor.m. If your MatLab version is older than 2021a, you need to modify the source code in the jlShowColor.m file and change the tiledlayout() to some equivalent functions, such as subplot().
By default, the user-defined scripts, functions and tools are placed in directory ~/Documents/MATLAB. Here I suggest you should also clone this jlcolor library to this directory:
Open MatLab and run following command to preview all the color schemes in the library:
1
jlShowColor('all')
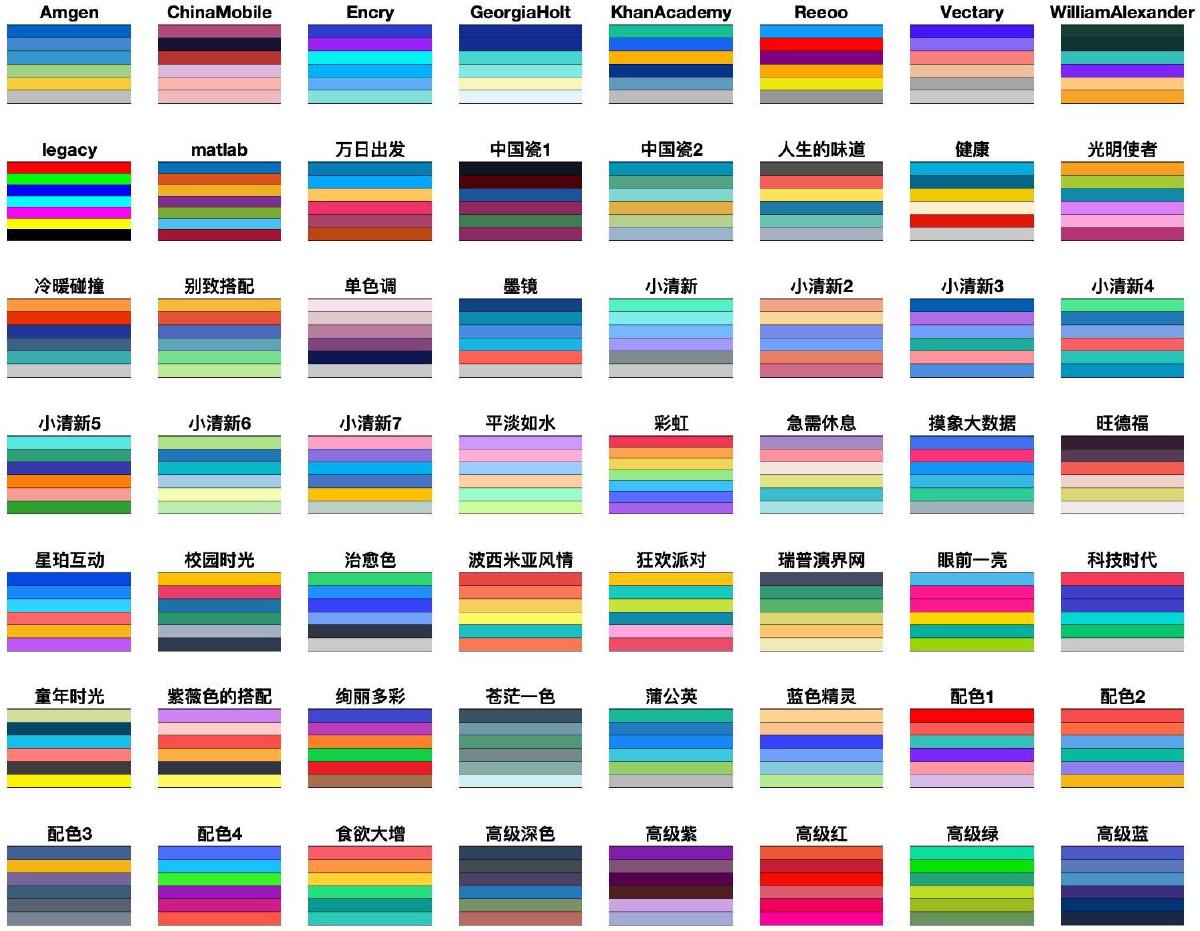
Then all the color schemes will show up with their names:
You can also preview a single color scheme. For example, you can use following command to preview the color scheme named “rainbow”:
1
jlShowColor('rainbow')
Get and Use a Color Scheme
You can get a color scheme in the library with function jlGetColor(). For example, using following command
1
c=jlGetColor('rainbow')
you can export the seven colors in color scheme “rainbow” to variable c.
Then you can use the seven colors when you make a plot. For example,
1
2
3
4
5
6
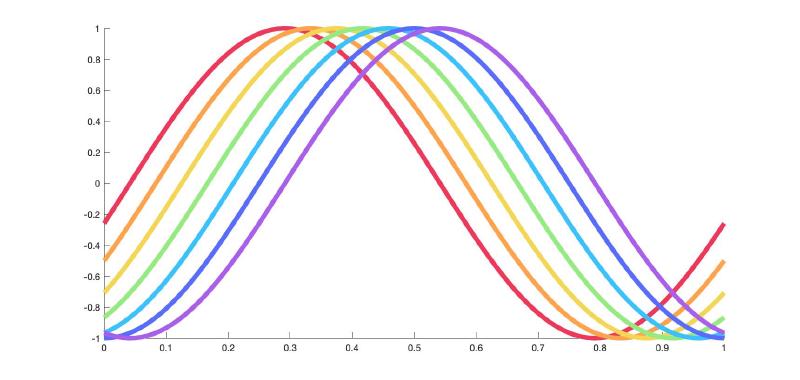
c=jlGetColor('rainbow');% get color schemefigure;holdon;x=0:0.01:1;fori=1:length(c)plot(x,sin(2*pi*x-pi*i/12),'color',c(i),'linewidth',5);end
Here is how the plot looks like:
Self-define and Save a Color Scheme
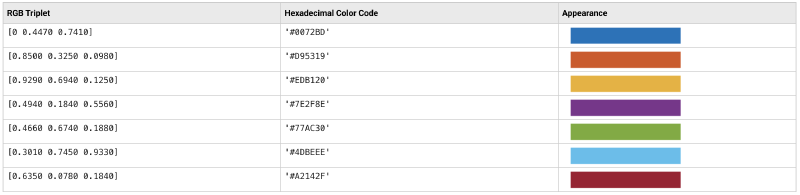
The color schemes are stored in file jlColorLib.m. Users can add color schemes to the file. For example, the default color scheme in MatLab is:One can add the hex code of the seven colors to jlColorLib.m by mimicing the existing color schemes in the file. So you can add another line in jlColorLib.m:
Create a Color Scheme by Sampling Points on a Picture
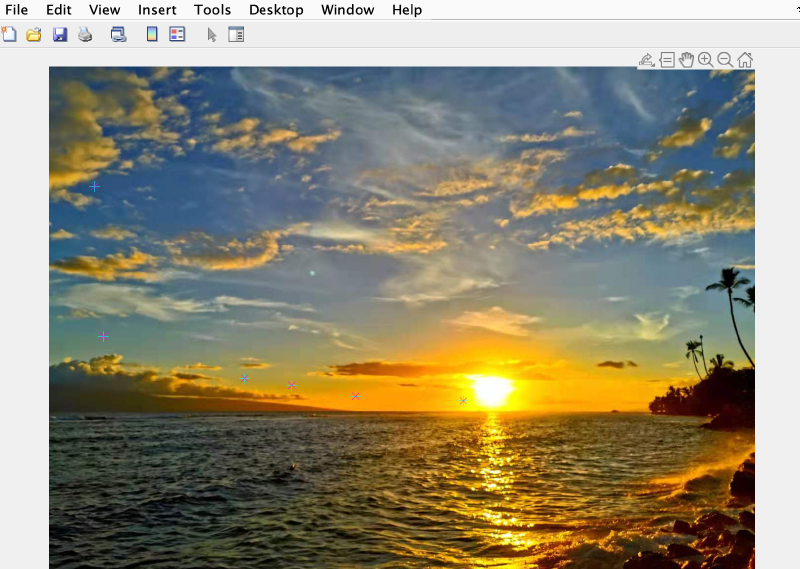
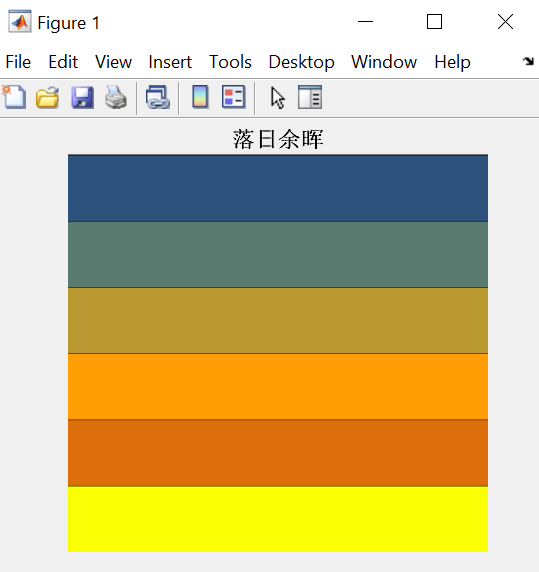
You can create you own color scheme conveniently by sampling points on a picture, with the help of function jlAddColorFromImage(). For example, the color scheme “rainbow” used above and the color scheme “sunset” in the library are all generated from pictures. Suppose you have the picture file “sunset.jpeg”, then you can run following command in MatLab’s command window:
1
jlAddColorFromImage('sunset.jpeg','sunset');
Then a window like below will pop out. And you can click on it with your mouse for the colors you need:Press Enter key when you are done selecting the points. Then another window showing the color scheme being created successfully will pop out!